Using Google Geochart in KB no info at hover / click

Two pages, content-wise the same, one uses Pangolin Page, https://reizen.jacqfish.nl/about, the other Kookaburra Page, https://reizen.jacqfish.nl/over-ons.
The Pangolin version shows pop-ups and highlights borders on hovering (or clicking on mobile); the KB version shows no result of the interaction.

Is this by design of KB (so need other/better solution?) or a KB bug?

Are any of your scripts using jQuery?

If so, jQuery is not supported in Kookaburra.

No use of JQuery by me, I doubt google.visualization.GeoChart is using it.

The pages show as normal, so the offered data is handled correctly. However, the handling of the user interaction is not happening.

the inspector console shows these errors:

These warnings are present in both versions, so unlikely the cause of the different behavior.

Looking at the https://www.gstatic.com/charts/loader.js script, I see references to jquery: uncompressed:"jquery.js",compressed:"jquery.min.js". By design, Kookaburra doesn’t support jquery. So you might want to try loading jquery first and see if this solves the issue.

1 Like

Adding jQuery does not make a difference.

I tried to get as much as possible out of the way. So, I have now two new pages PANG based on Pangolin and KOOK based on Kookaburra. Both with only content in the Main Copy:

<svg width="240" height="120">
  <rect x="20" y="20" width="200" height="100" stroke="red" stroke-width="6" fill="blue">
    <title>SVG RECT TOOLTIP</title>
  </rect>
</svg>
<svg width="100" height="100">
  <circle cx="50" cy="50" r="40" stroke="green" stroke-width="4" fill="yellow">
    <title>SVG CIRCLE TOOLTIP</title>
  <circle/>
</svg>

On these two pages:

  • PANG shows tooltips
  • KOOK shows no tooltips

Adding only that to the body of simple page (locally) to test the layout:

  • PANG shows layout incorrectly
  • KOOK shows layout correctly
  1. I assume that there’s some javascript code handling the tooltip action. @Matthew would know more about that.

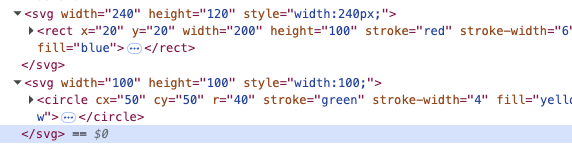
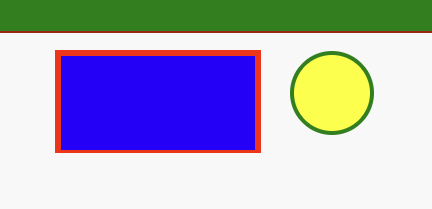
  2. CSS styles have preference over width and height. This is the CSS that overwrites your width and height parameter. It comes from Backlight (backlight/publisher/gallery/stylesheet/style/30):

svg {
    height: 100%;
    width: 100%;
}

This is the code I’m using to check:
image

With that the SVGs for the two platforms look the same.
image

The reason is that pointer-events: none is set in Kookaburra, thus:

circle, ellipse, line, path, polygon, polyline, rect, symbol, svg, use {
	pointer-events: none;
	user-select: none;
}

Wrap your charts in a scoped container:

<div class="chart">
	<!-- chart embed -->
</div>

Try some CSS like this:

.chart svg {
	pointer-events: auto;
}
1 Like

Thanks both @Daniel and @Matthew. With this info I have corrected my site.

The CSS settings of the svg and the therein used form need both the specific setting in css. So to reset for all I used in custom css:

.chart  circle, ellipse, line, path, polygon, polyline, rect, symbol, svg, use
{
	pointer-events: auto;
}
1 Like